Years: 2021-2022
The Problem
Web analytics platforms provide valuable data about your website's performance. The number of page views, visitors, and time spent on pages are typical metrics that these services offer. Using this data, website owners can find ways to improve their website. Google Analytics is by far the leading platform in this space. However, Google collects excessive amounts of user data which they use internally for their own benefit. Google Analytics is also difficult for non-experts to use due to the overwhelming quantity of metrics provided and the technical jargon used.
I saw an opportunity to build a simpler web analytics platform with better visitor privacy.
My target demographic was small to mid sized companies or organizations with websites that had less than 30,000 monthly page views. The reasoning for this is because large businesses would need (and already have) a more advanced web analytics platform. My ideal customer would be someone with a fairly small website that didn't currently use a web analytics platform.
Research Process
User Flow Diagram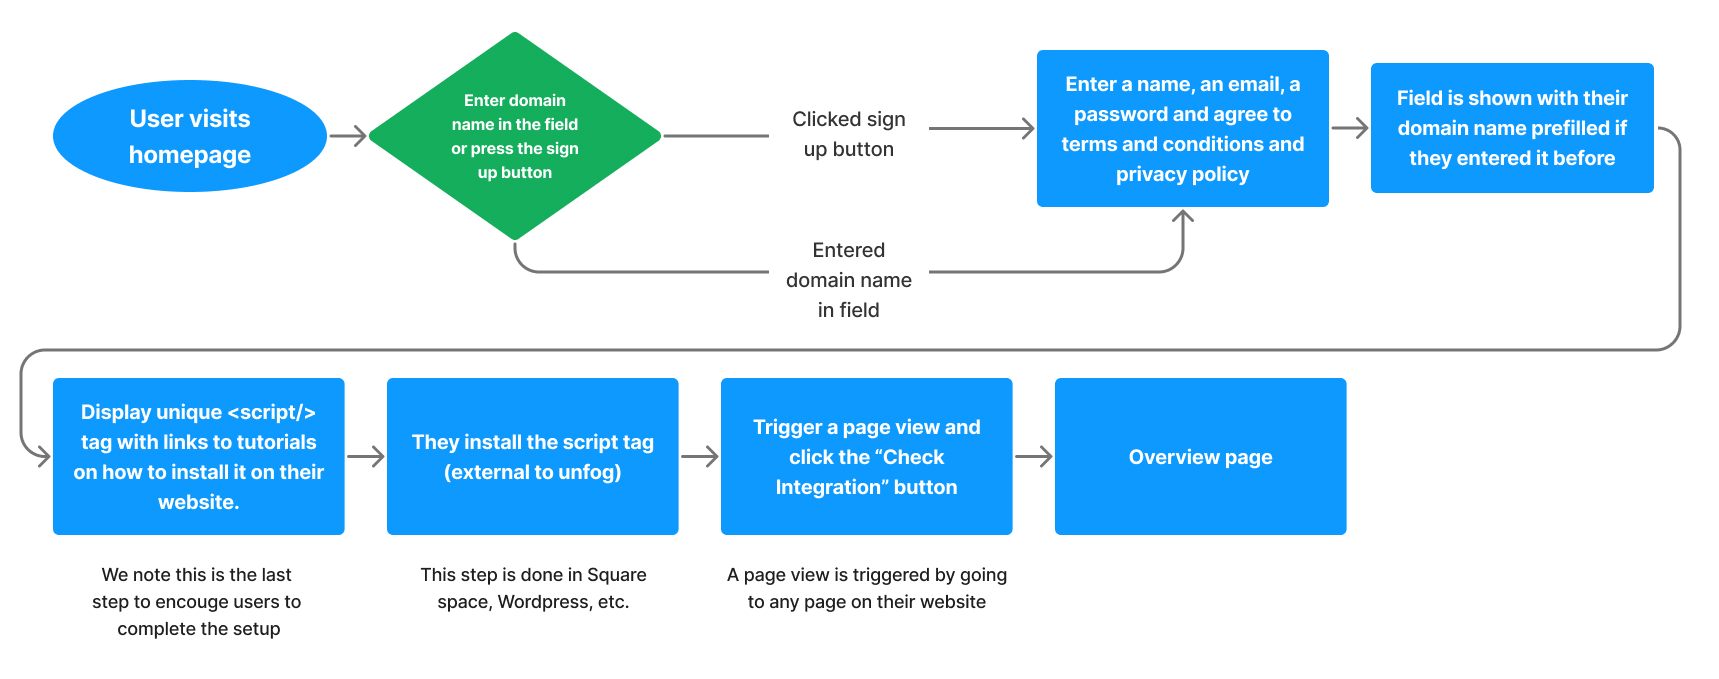
Click to enlarge
I created a user flow diagram to define the onboarding process. All web analytics platforms require the user to install a JavaScript script on their website. This step is necessary but can be daunting for some users. To counteract this I made the rest of the onboarding process minimal. Specifically, we don't make the user verify their email, enter their payment details, or ask them for any unnecessary information.
Design Process - Wireframes
The design process was a challenge because I had to determine how to best display the visitor metrics. I started with very rough wireframes to conceptualize where the information is display and the format is it displayed in.
Current Page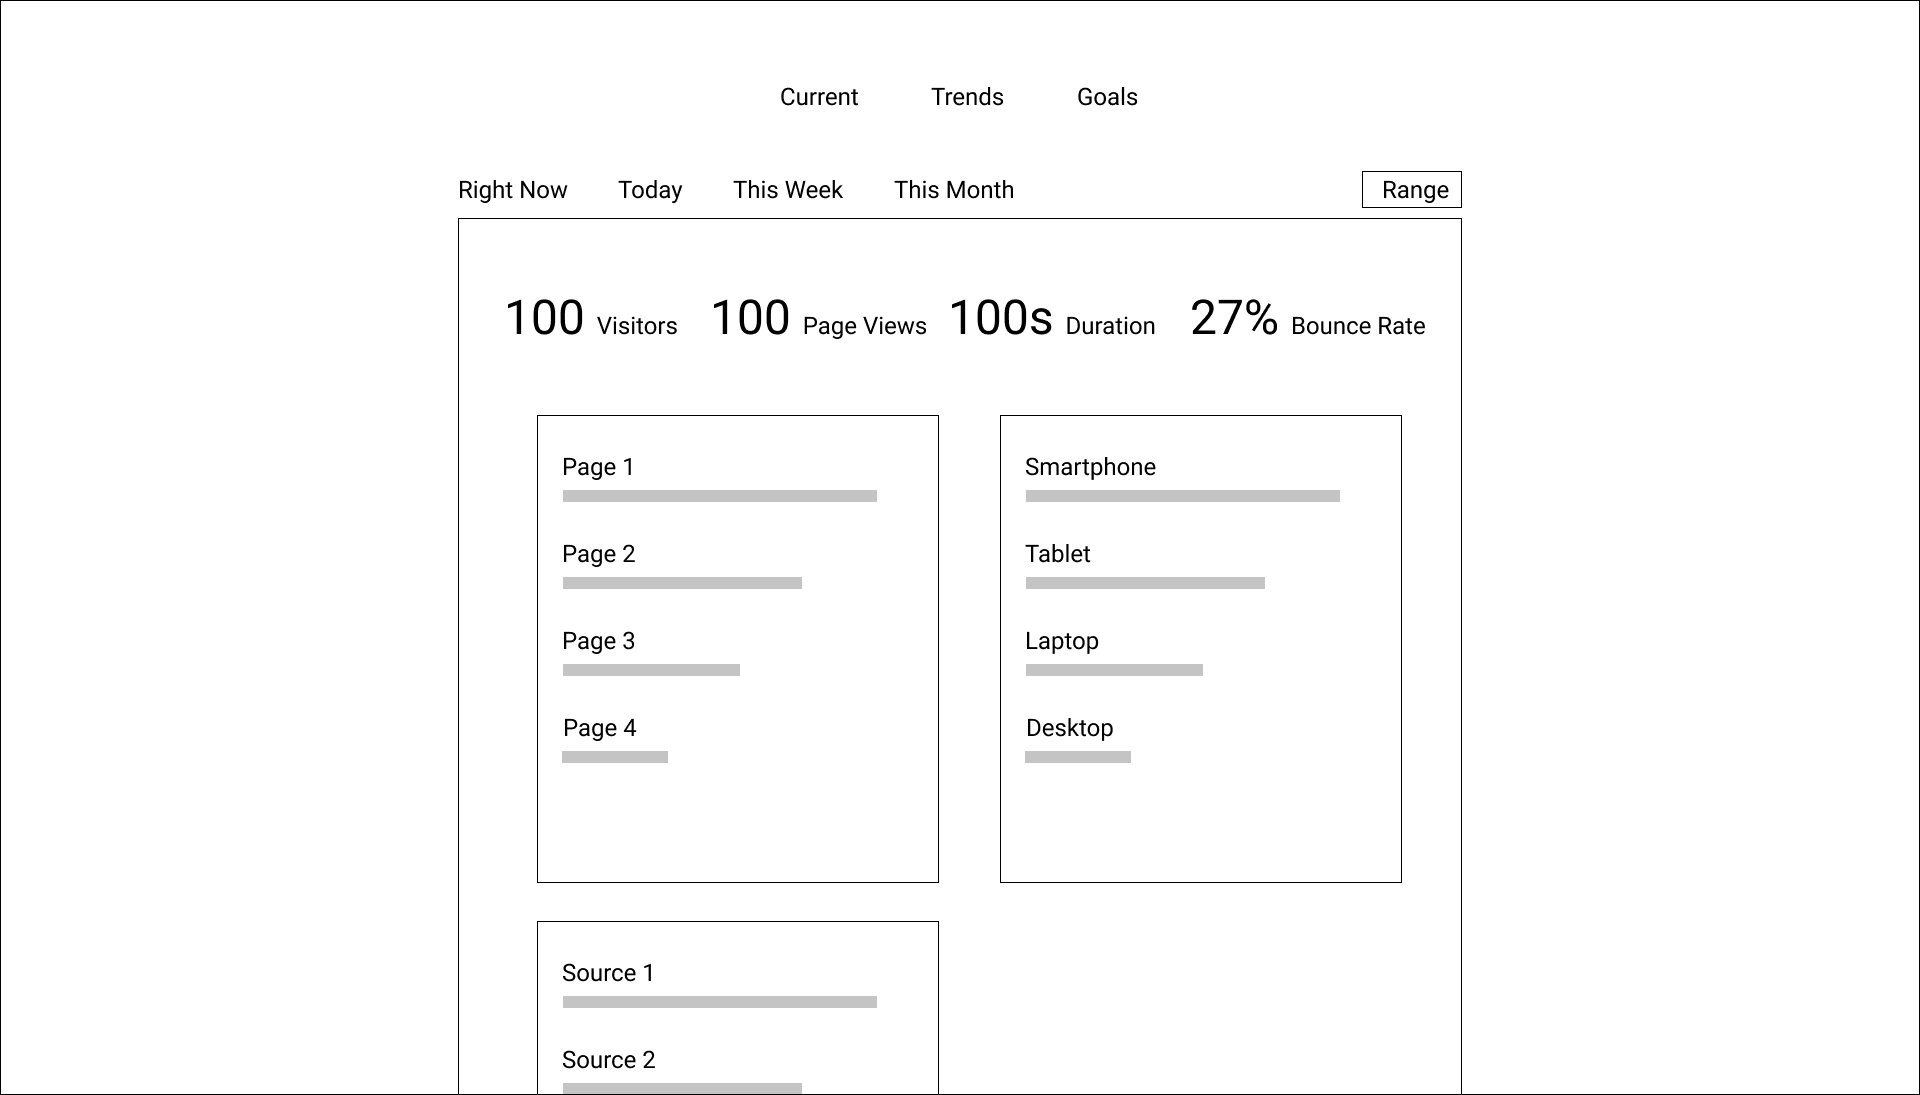
Separating the information among different pages would help to avoid information overload. We have 3 separate pages - "Current", "Trends", and "Goals". In the row below we have different time periods to pick from. Sometimes users want to only see the data from the current day, sometimes they want to see this week's data, etc. The "Range" text represents a date range picker button.
Trends Page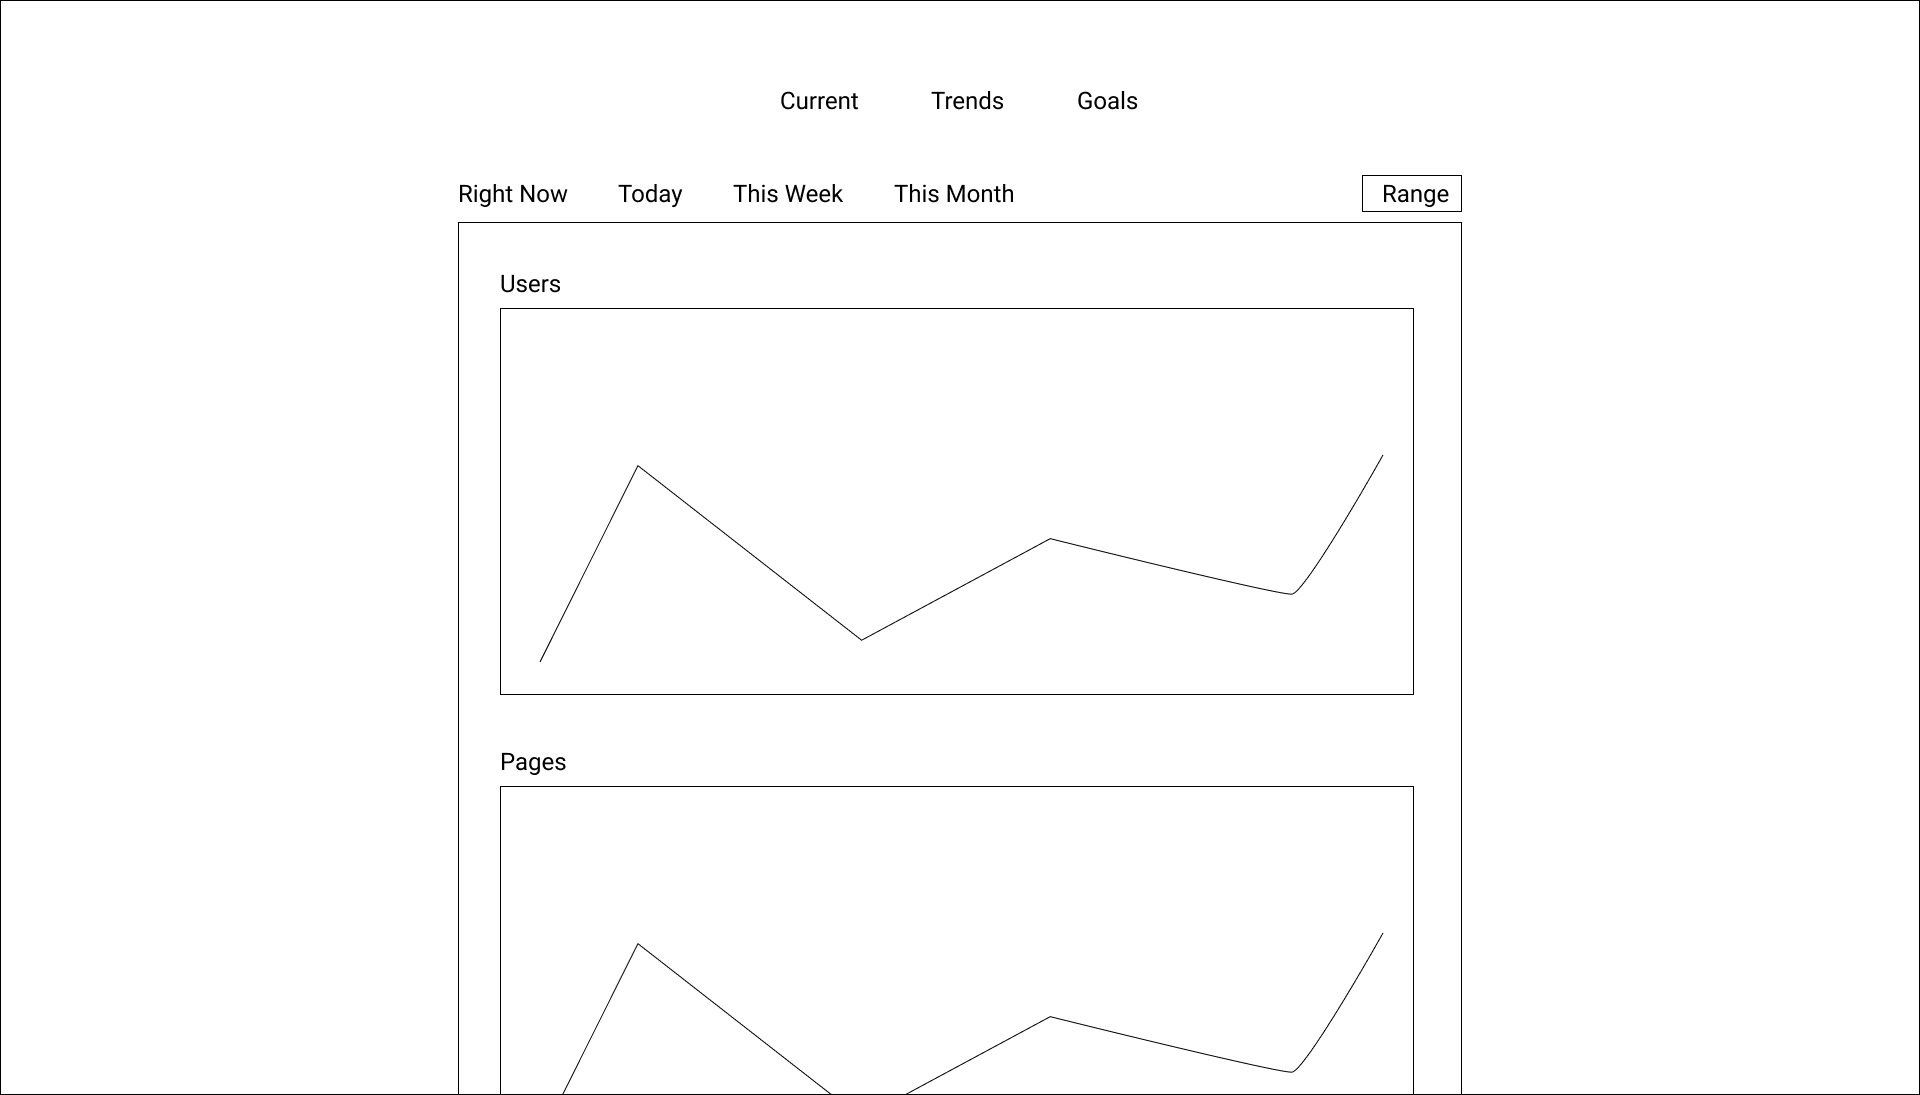
The Trends page is where all the graphs would be displayed so you can see changes over time. The user would be able to track the number of visitors (users) page views, etc.
Goals Page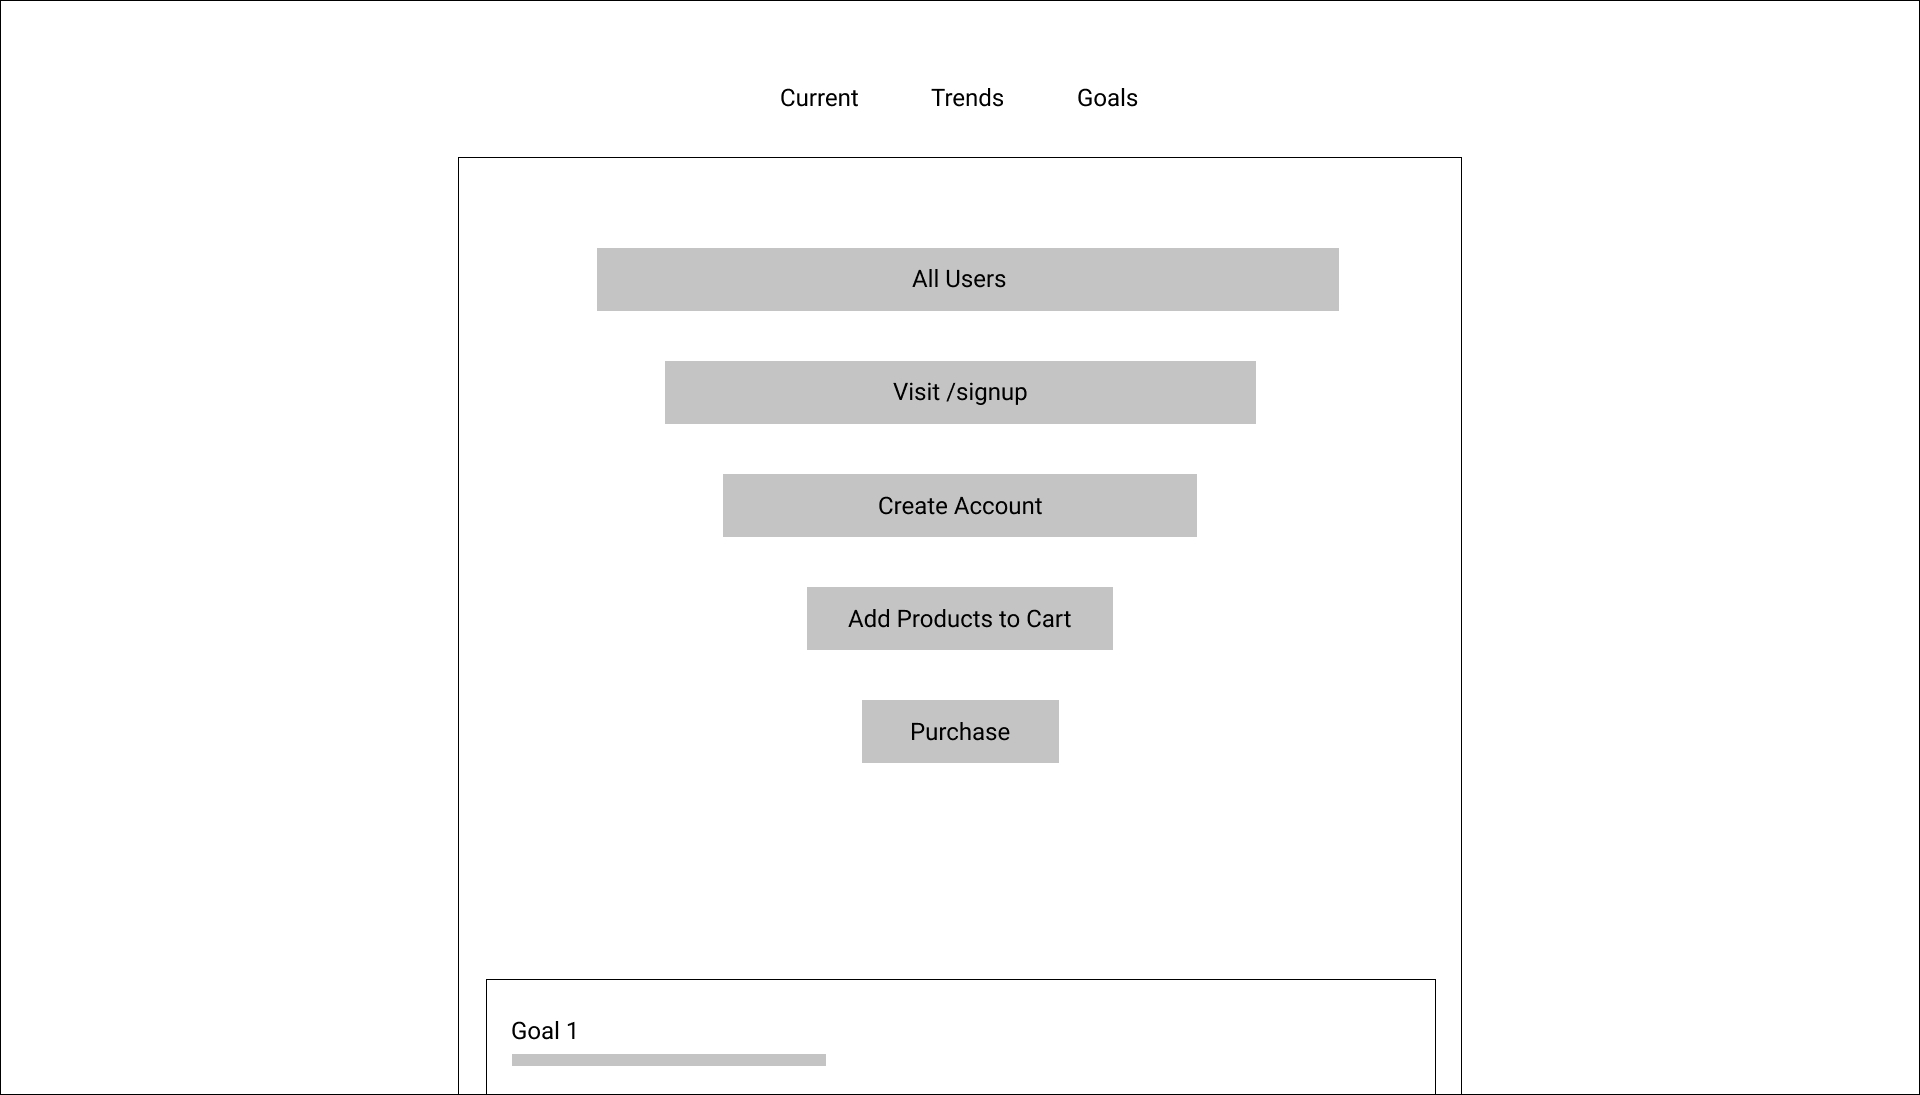
The Goals page would show a basic visitor (user) funnel with goals. Unfog users could define goals for the website like "get 100 visitors in a day".
Design Process - High-fidelity Mockup
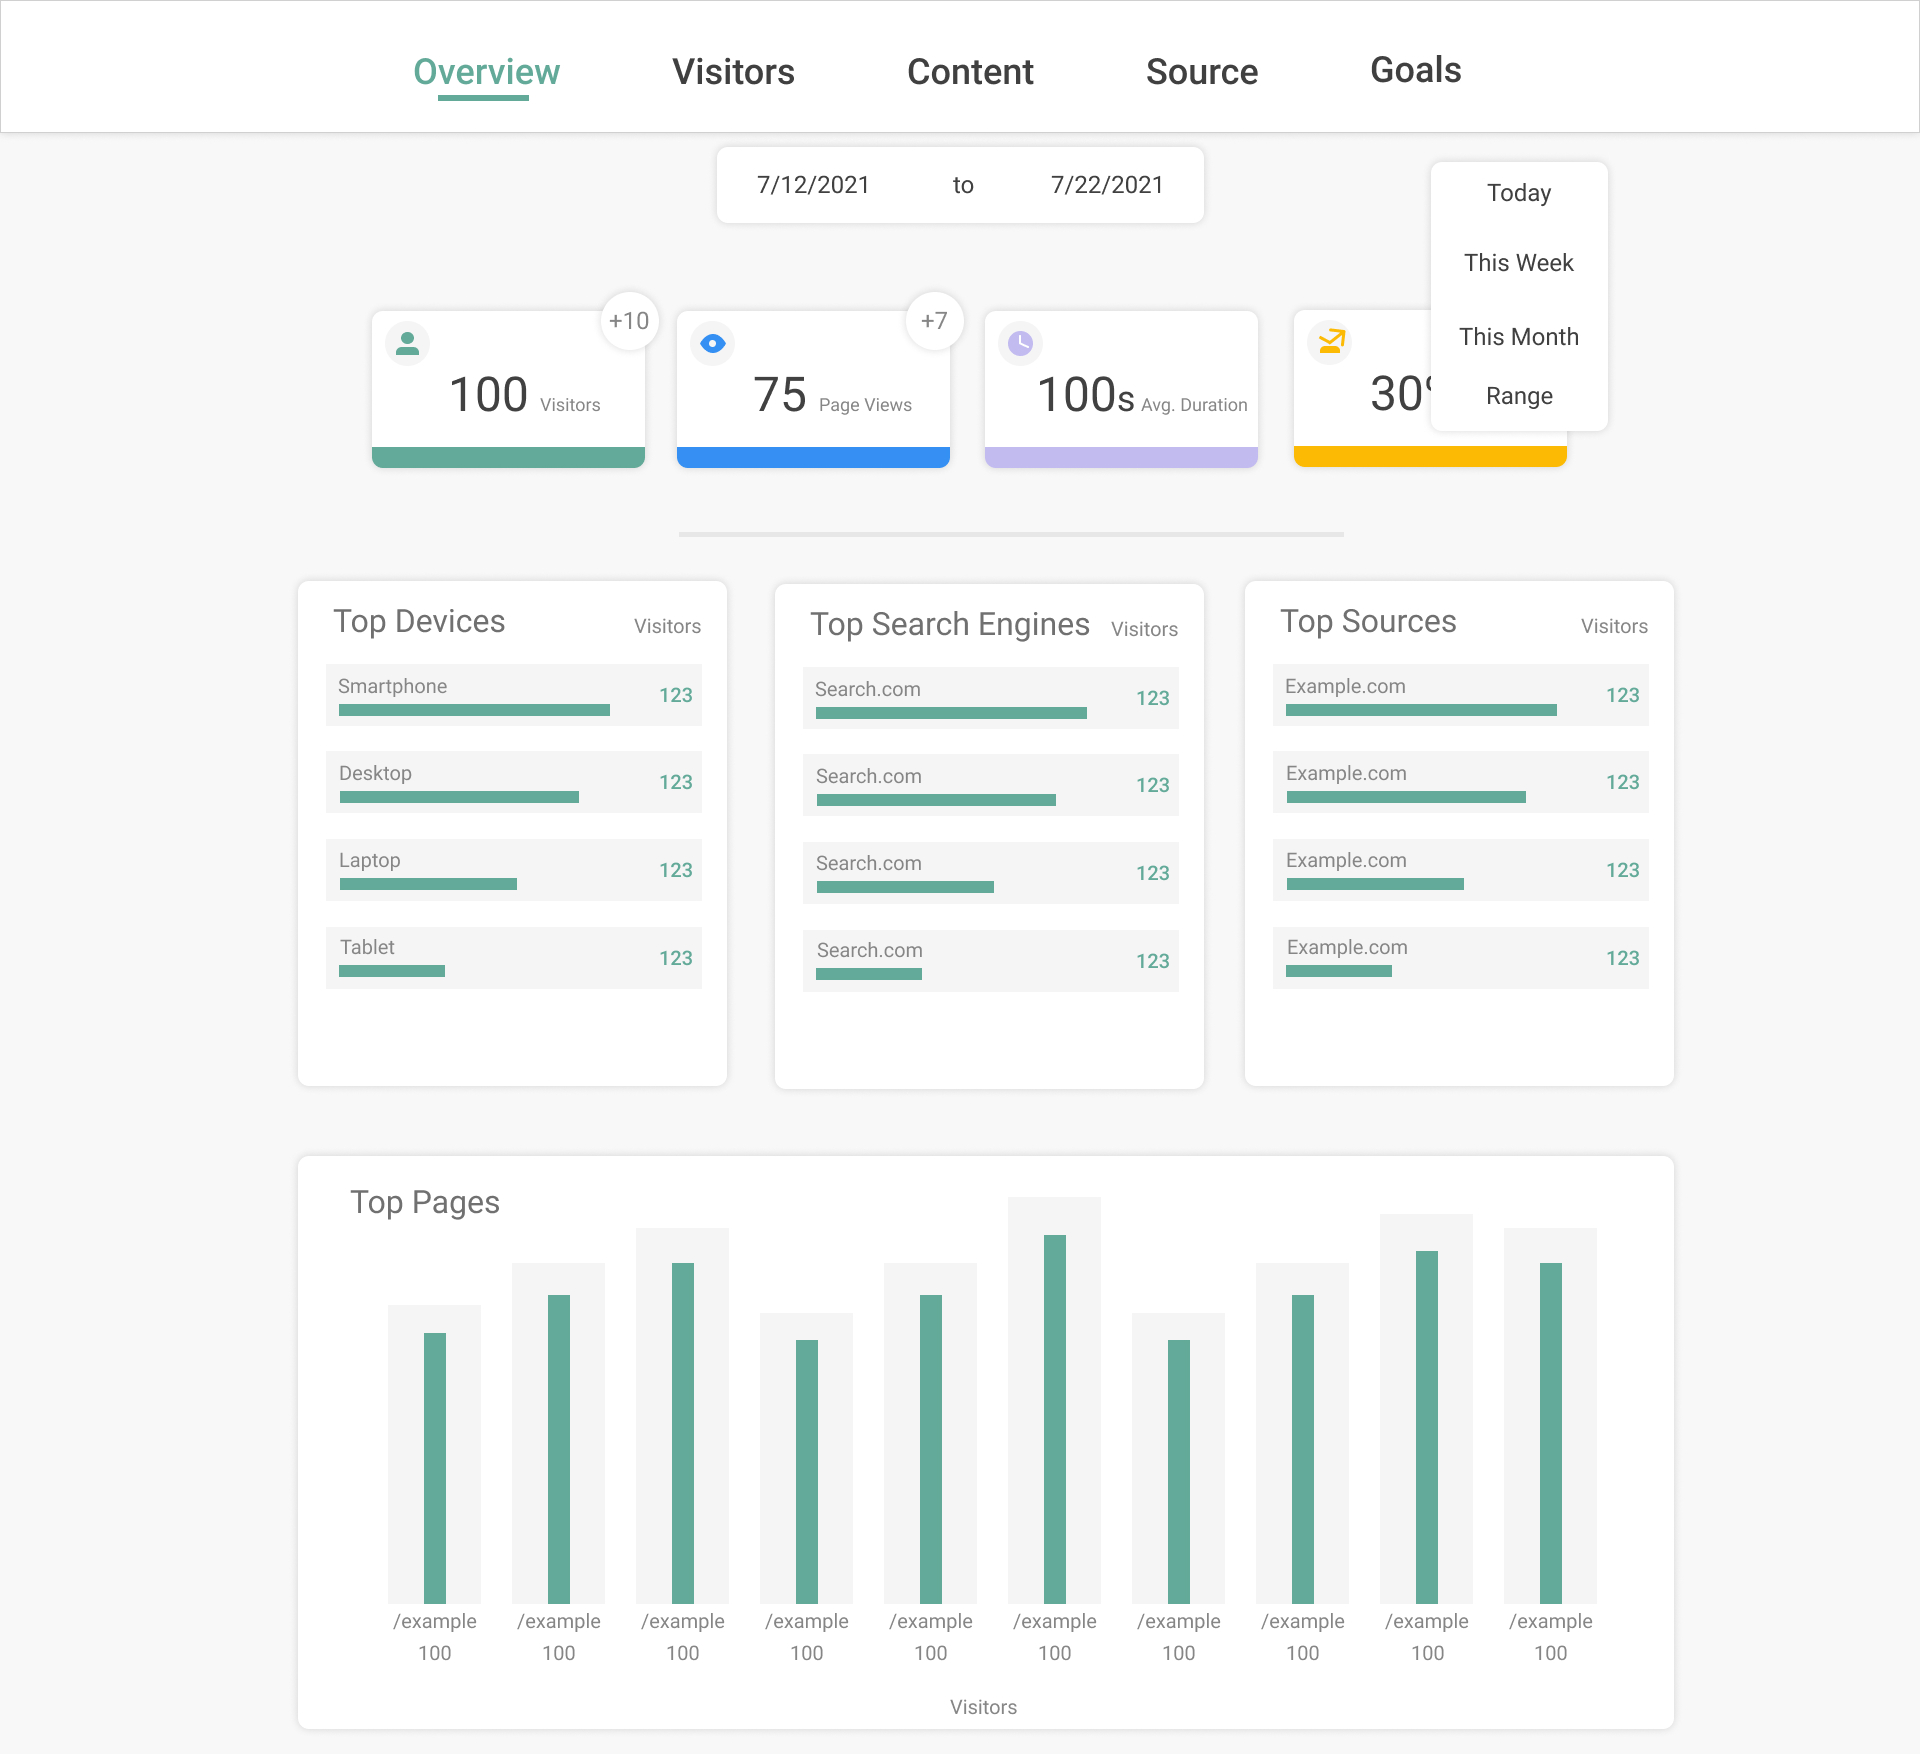
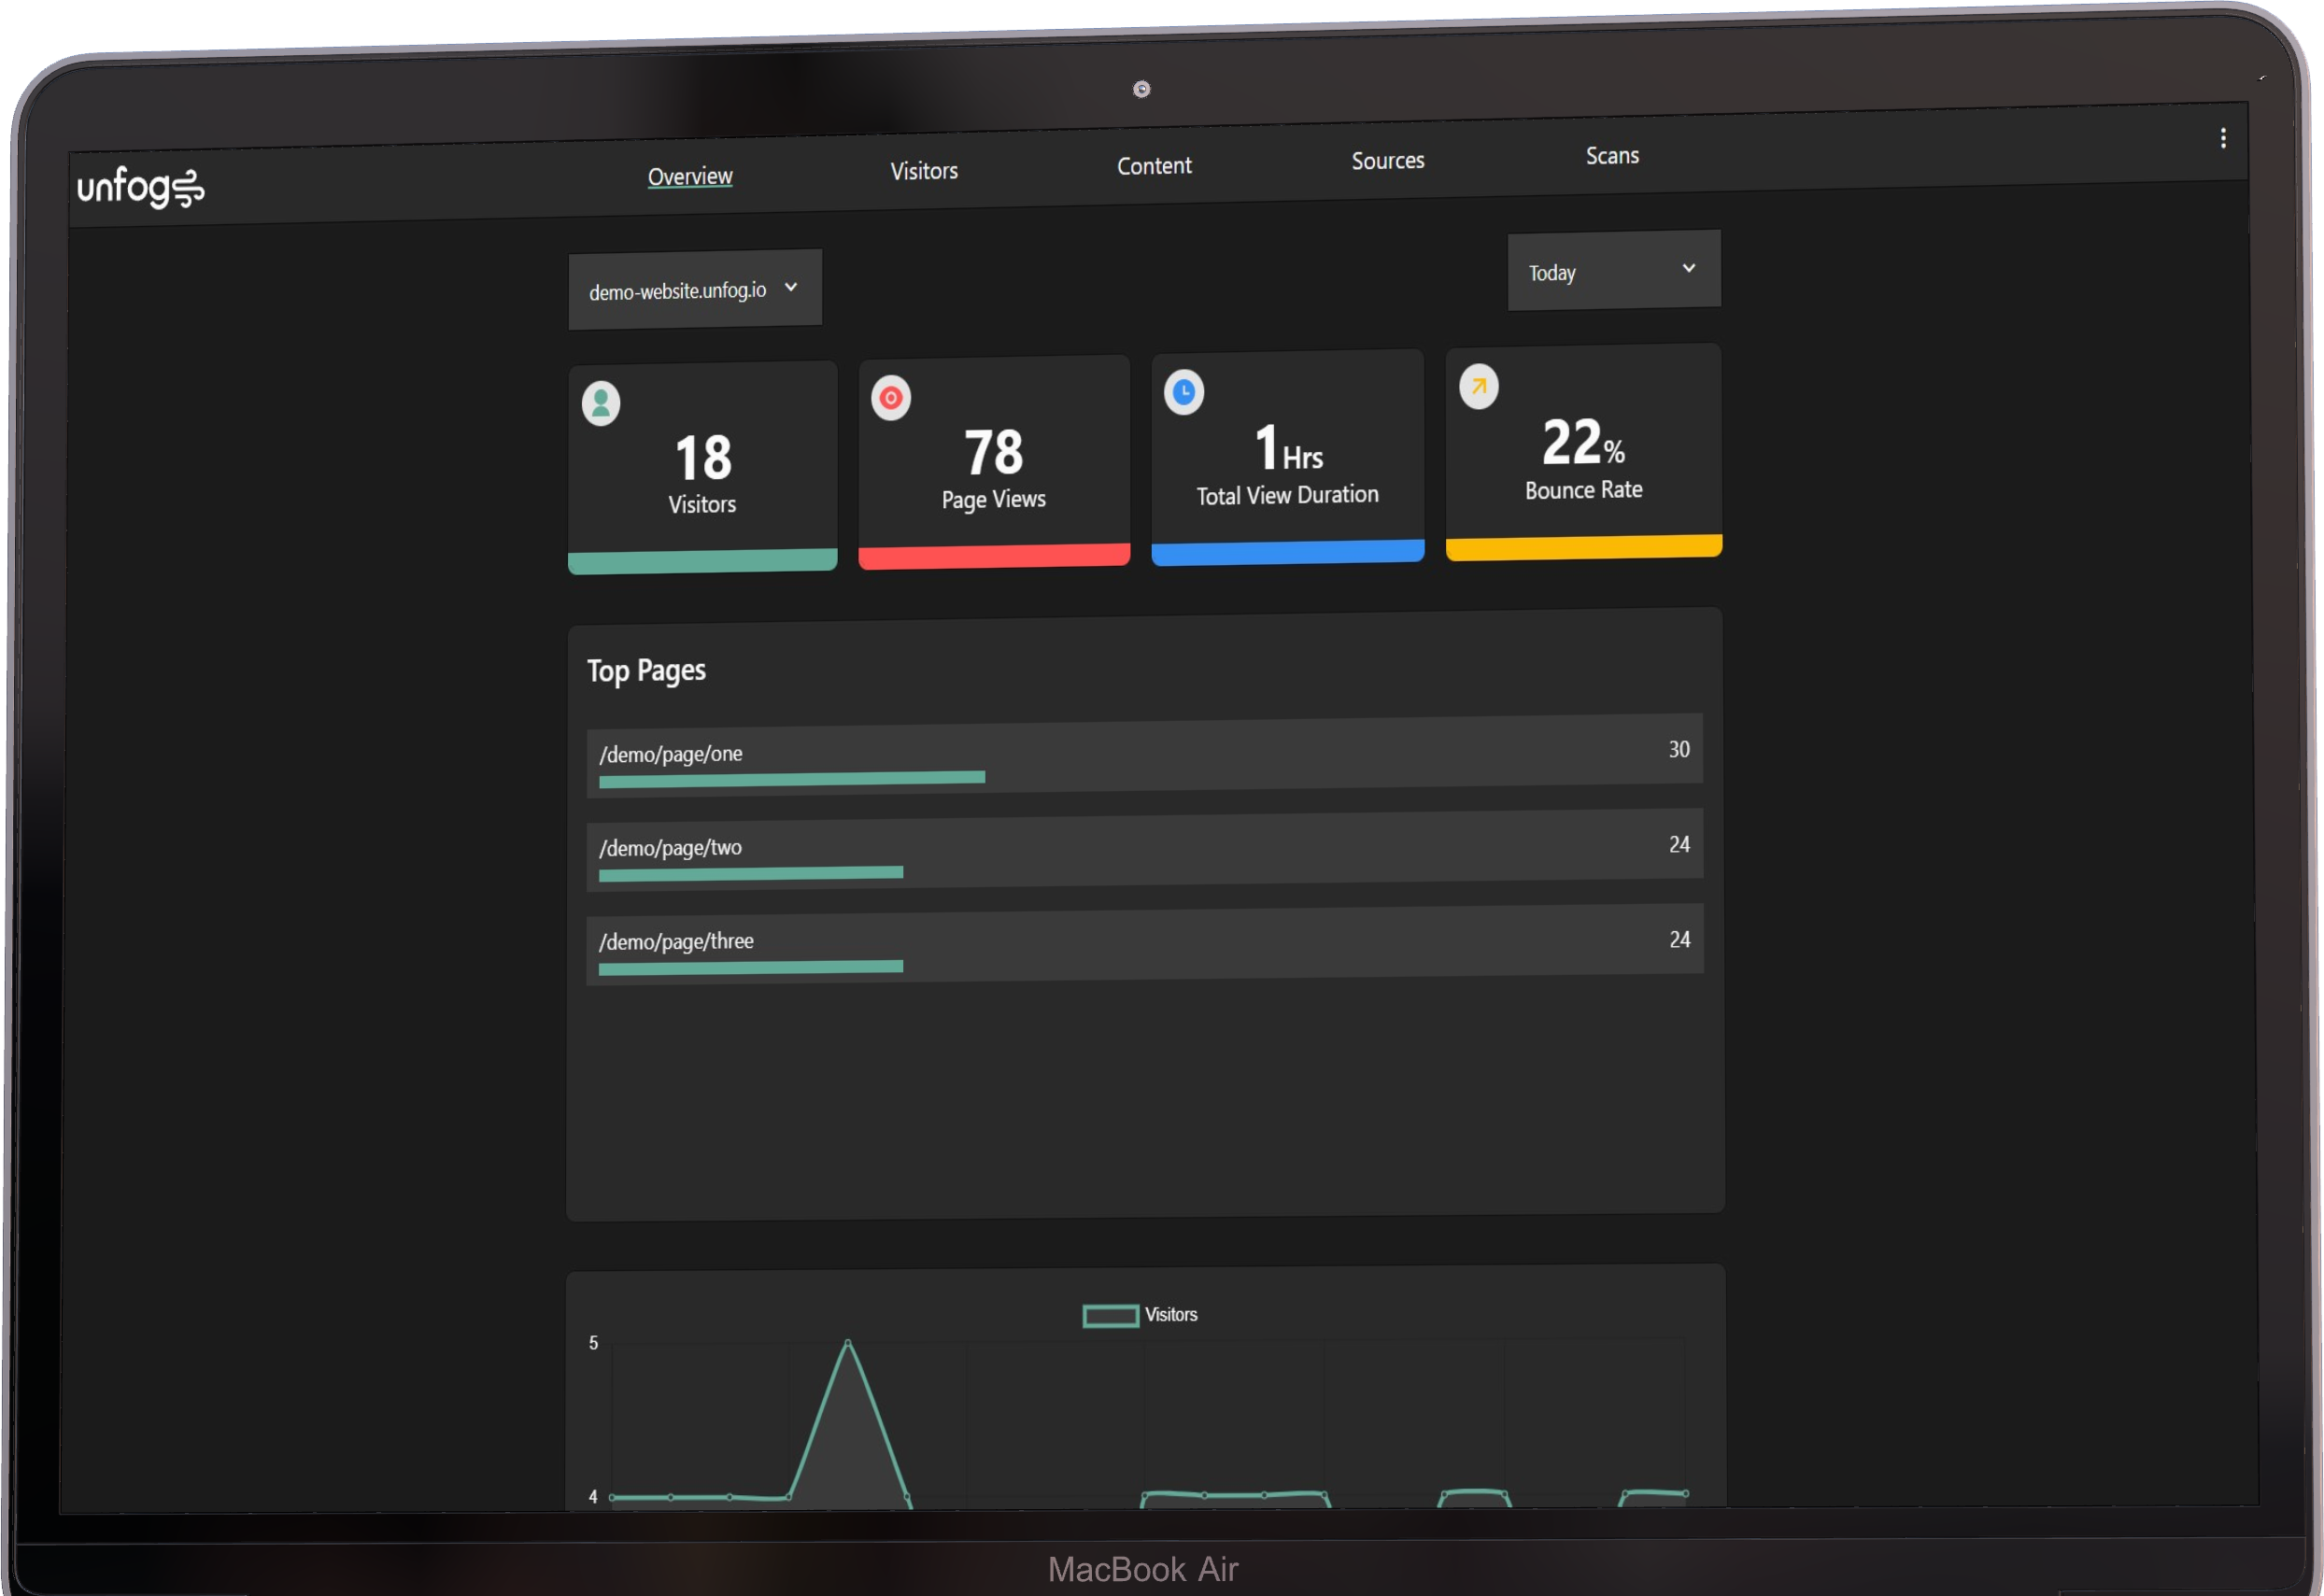
While designing the high-fidelity mockup I came up with a better way to separate the pages. The "Overview" page would give you the rundown of your site. The "Visitors" page would tell you about your websites visitors. The "Source" page would show where those visitors come from (ex: Google). Then the "Goals" page would remain the same. This would provide users a way to look at a specific aspect of their website at a time so they don't have information overload.
The UI consists almost entirely of charts and graphs. For the mockup I focused on the design for those UI elements and only needed to mock-up a single page. The other pages would be laid out the same way and use the same UI elements.
Design Process - Style and Branding
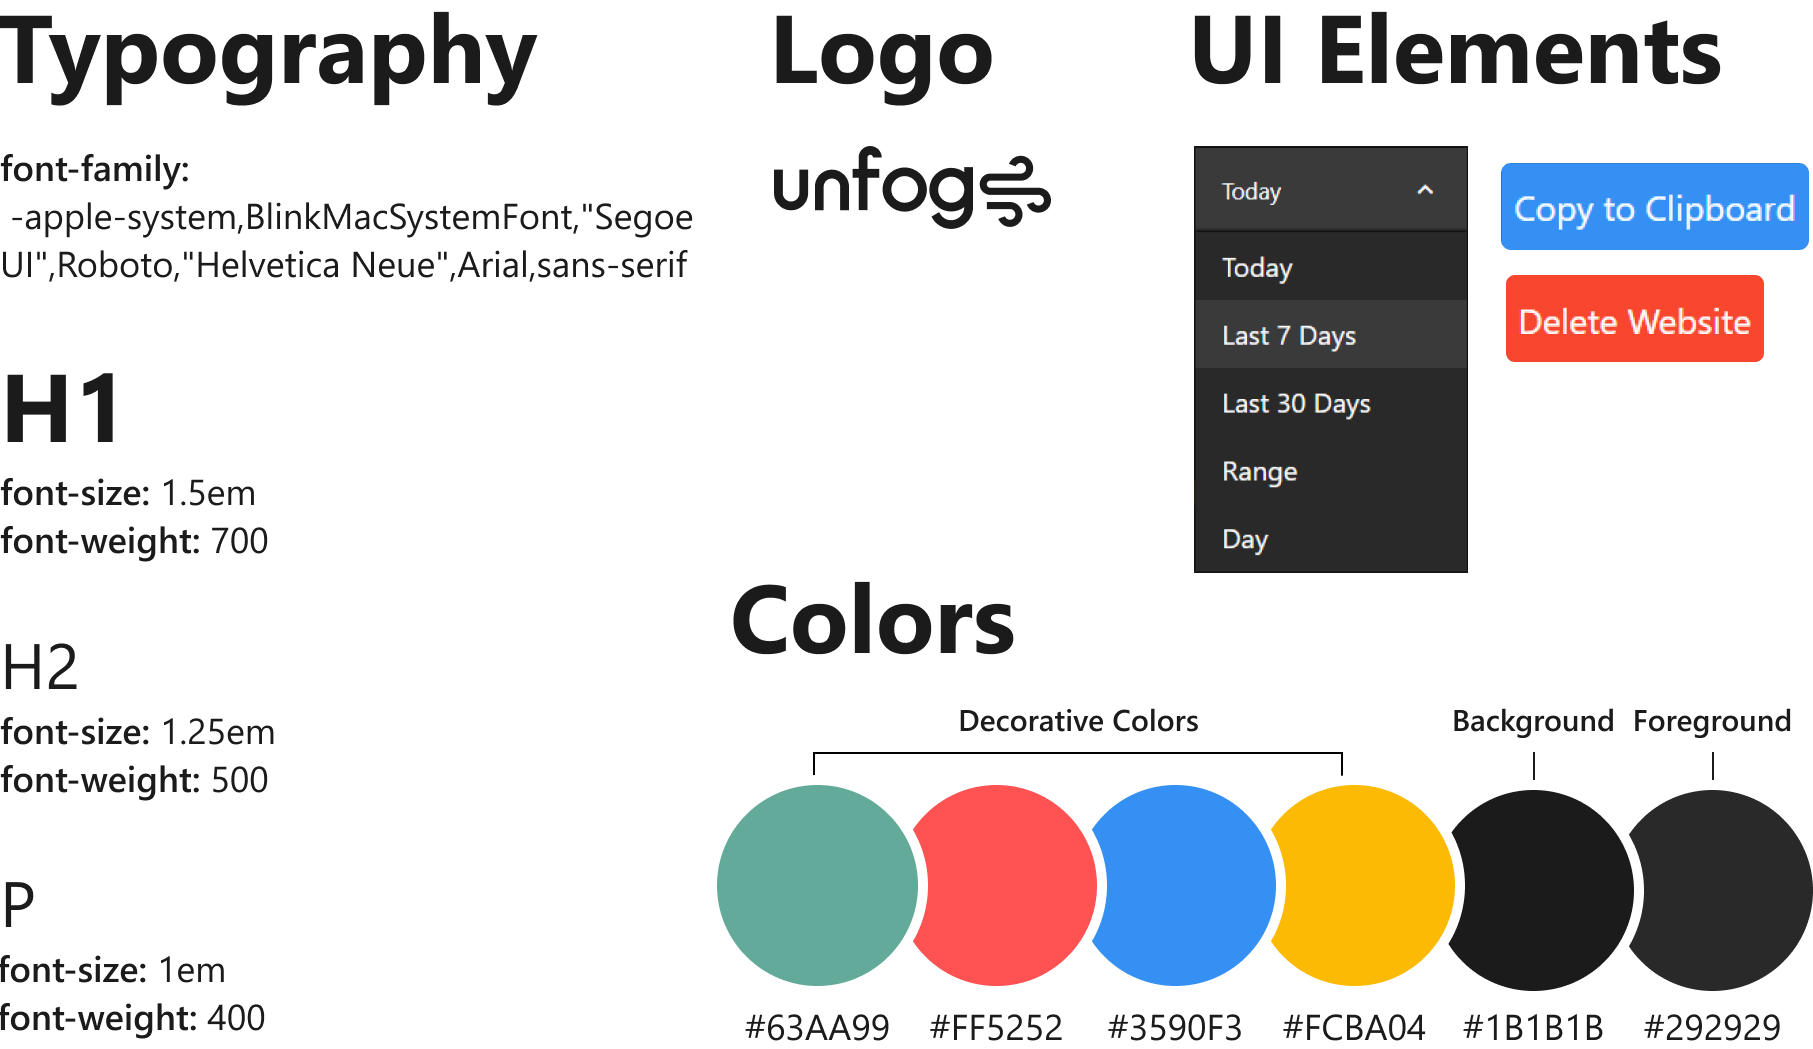
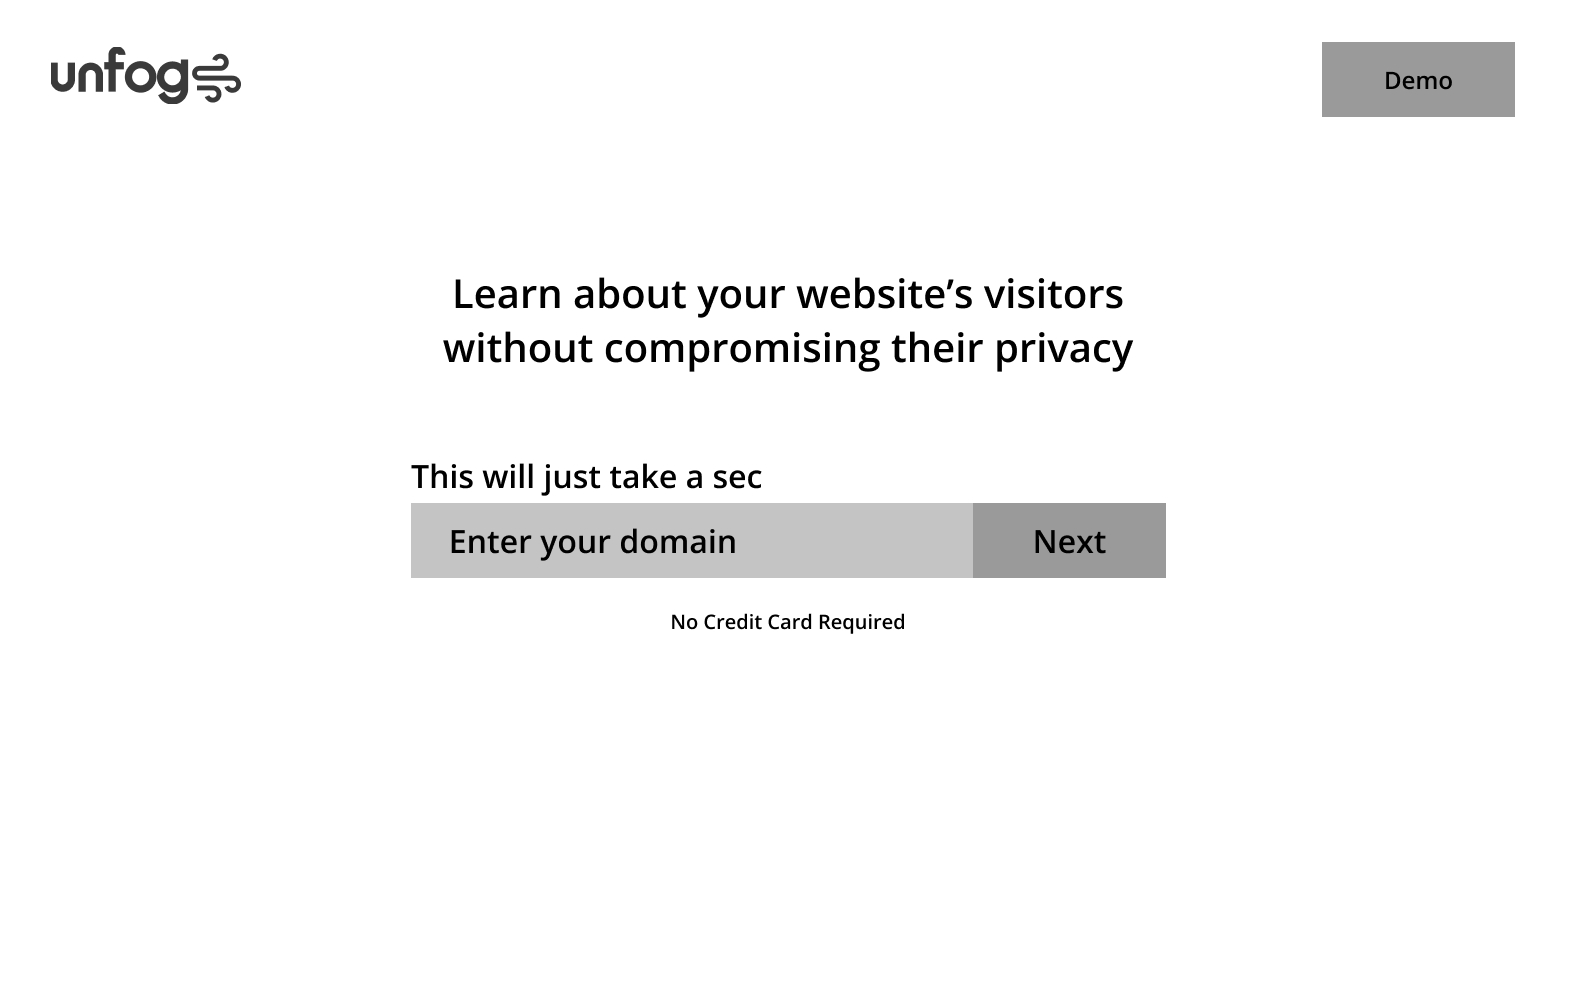
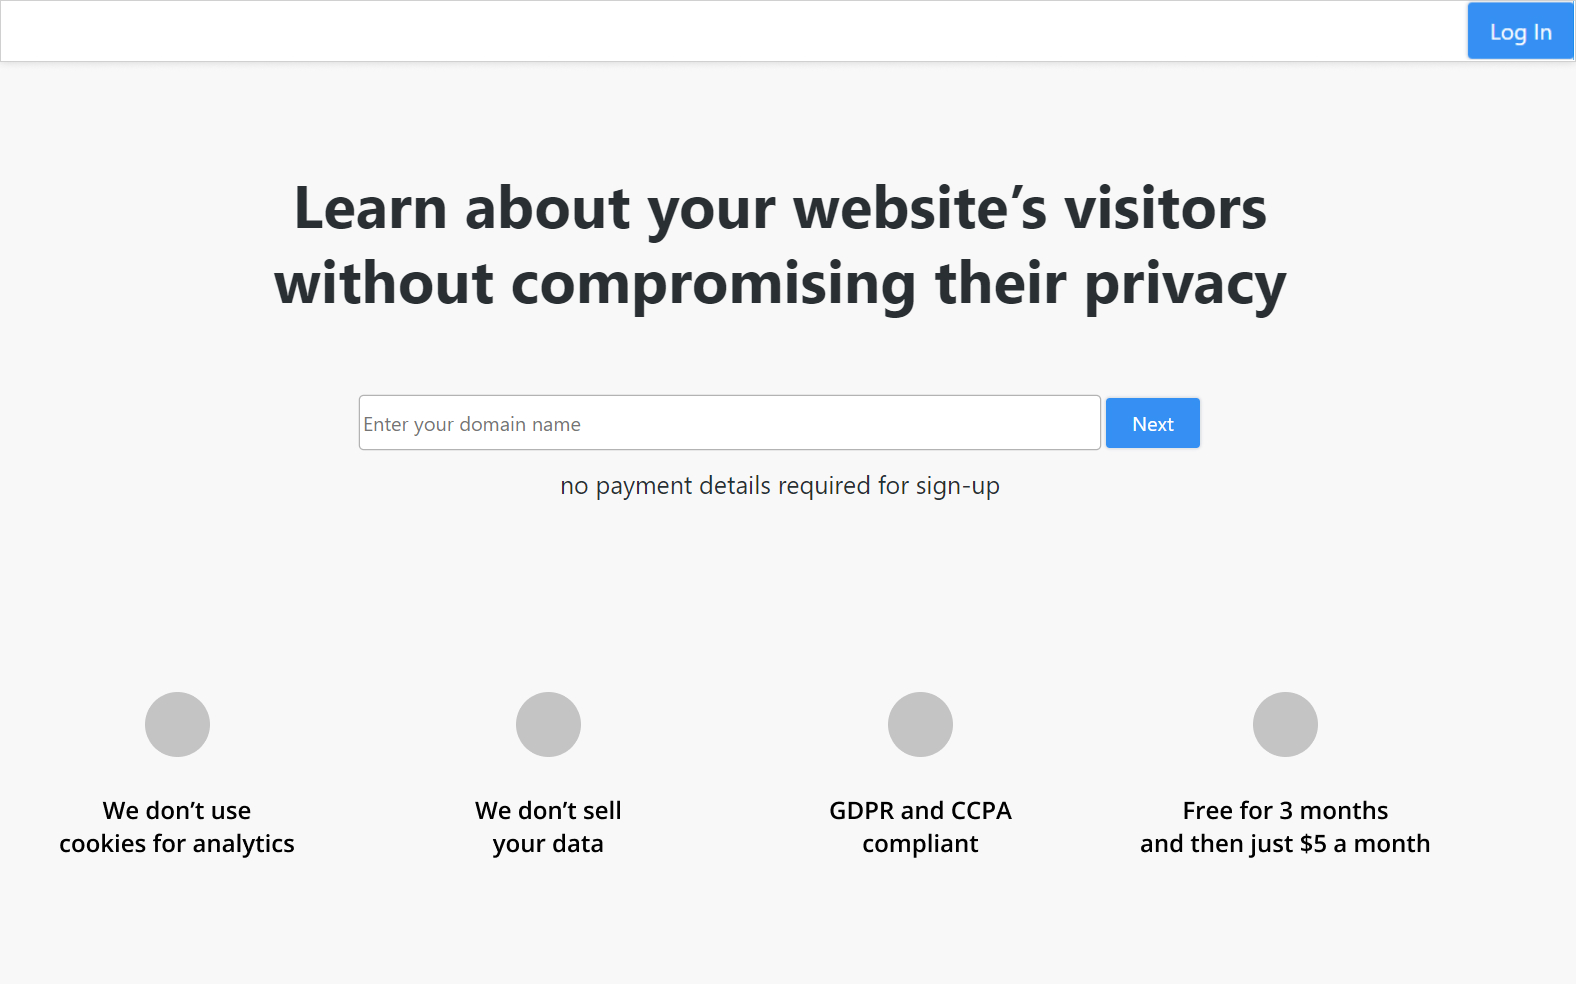
For the homepage of the website I focused heavily on enticing users to sign-up.
And then I built it
Technology Stack
Back-endI used NodeJS as the backend with ExpressJS as the Web Application Framework. As the only developer on the project, using the same language on the back-end and front-end was a big advantage as I'd constantly be switching back and forth. Plus I was already familiar with both NodeJS and ExpressJS. For the database I chose MySQL due to it being general purpose.
Front-endOn the front-end I used ReactJS as the JS framework. A JavaScript framework was essential for this project due to the ability to create components.
Payment ProcessingI used Stripe for payment processing. They are a leader in the space and have excellent documentation.
HostingI have experience with many different hosting services: AWS, GoDaddy, Google Cloud, and 1&1 ionos. However my favorite is DigitalOcean as I find their interface to be the least cluttered and I can make changes easily without digging through menus.
Development Process
The MVP took over a year to complete with 262 GitHub commits and over 2000 lines of code. The most challenging aspect was figuring out how to calculate the various metrics and writing the necessary SQL queries. I was still an SQL novice and at times I would be stuck for hours writing a single query.
MVP
Onboarding Overview, Visitors, Content, and Sources pages Page Scanner Settings and managing SubscriptionCollecting Feedback
A perfect fit for this type of product was the company I freelanced for, Intracom Systems. Intracom has handful of different websites and wasn't using any web analytics platform. My boss was generous enough to let me test the product on their websites. Unfog's value was clear almost immediately. We were able to determine where visitors were coming from, which webpages were getting the most visits, which were getting the least, and uncover a variety of accessibility issues. The test was such a success that Intracom became my first customer and still uses unfog.
I was able to track down these individuals on Twitter. I primarily looked for one-person statups and direct messages them to ask if they'd like to try the product out and linked to the homepage. Most of the time I didn't get a response back however I did get valuable feedback from about a dozen people. I repeatedly was asked:
- • Is unfog open source?
- • How is unfog different from ___?
- • What data is collected and how is it used?
"You say it is privacy-focused, but there is no proof. I do not see any person who is behind the project, and I do not know the code. How can you guarantee that you won't hijack my sites or sell the data?" - Jesse
Implementing Feedback
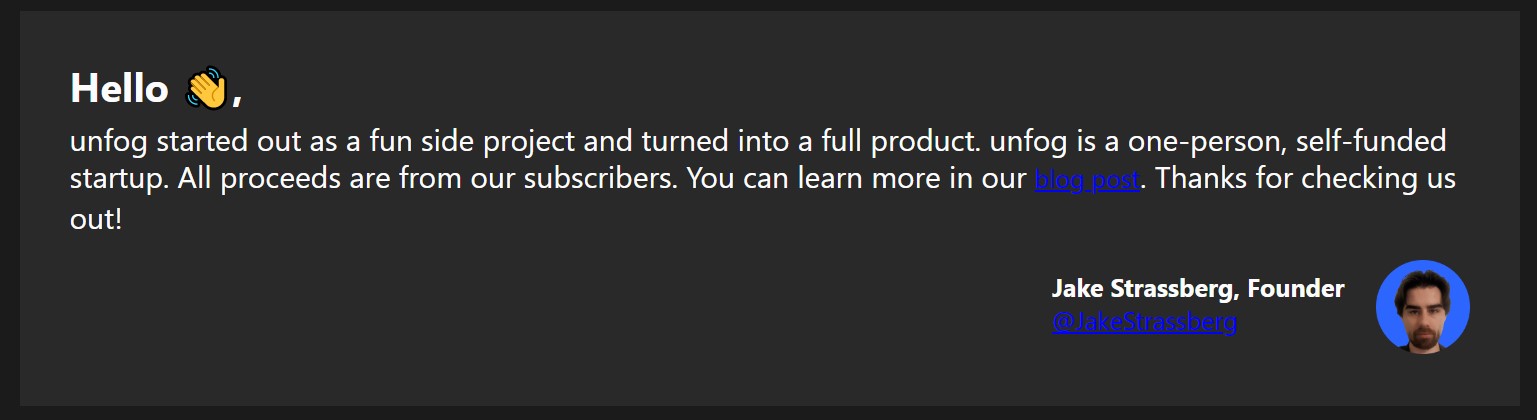
Based on the feedback I received a section was added to the bottom of the homepage that briefly covered who I am and why I made unfog.
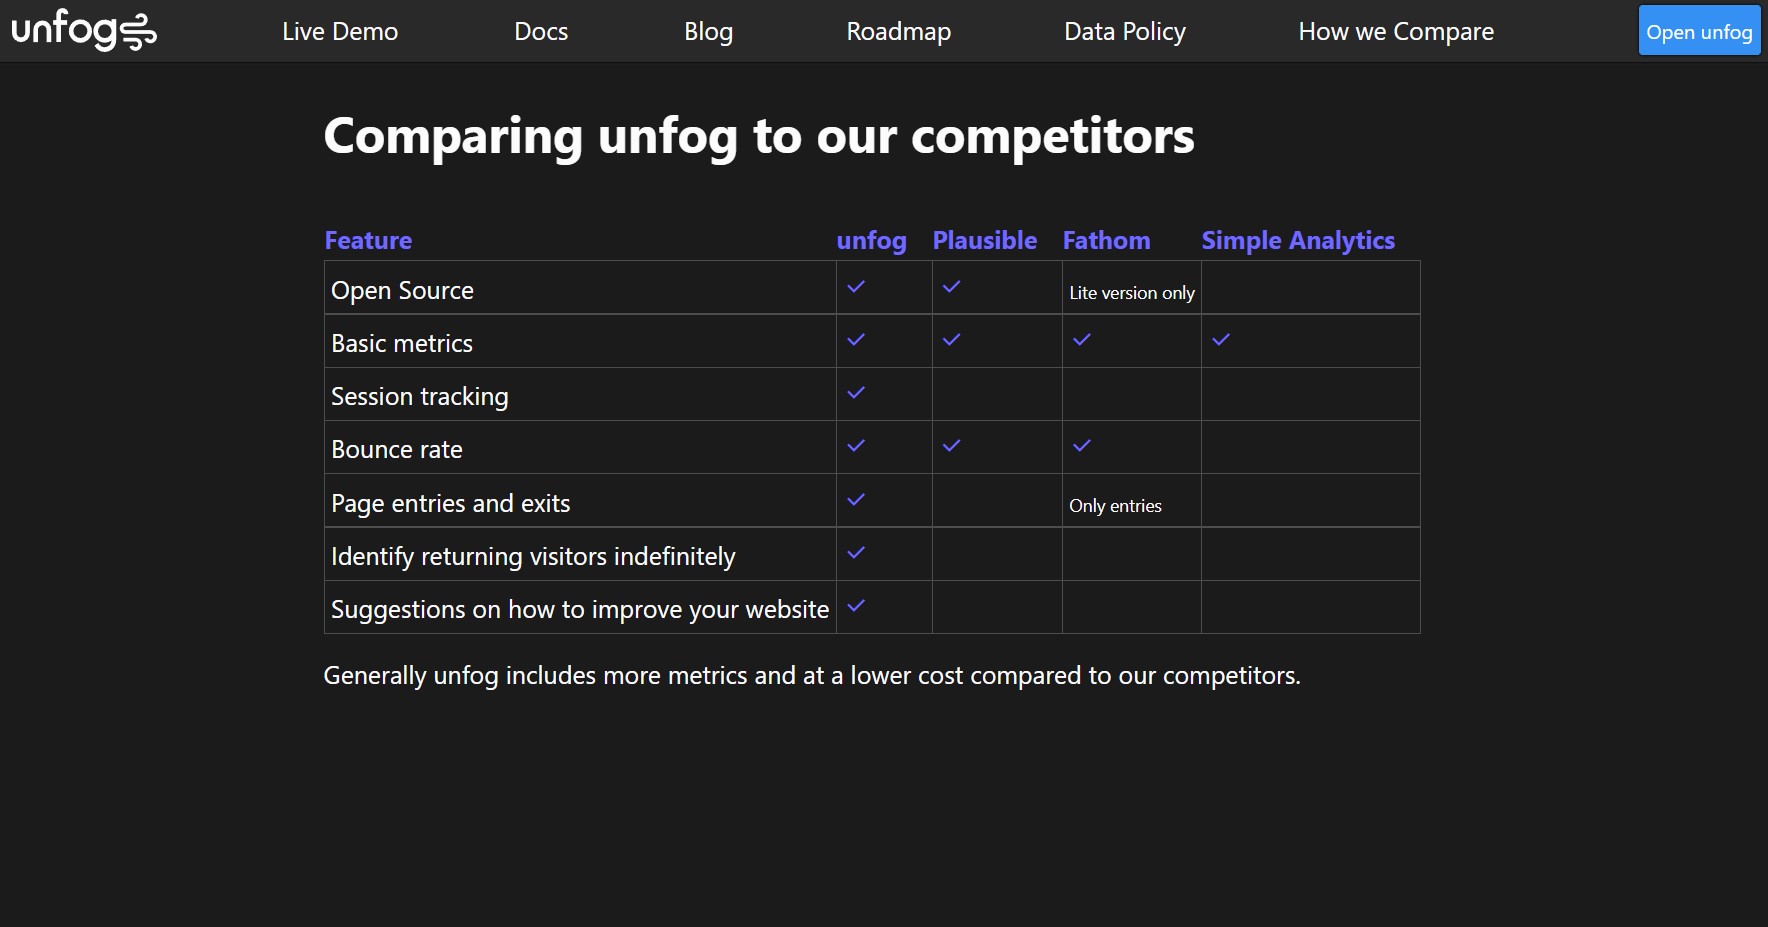
A feature comparison chart was added to the website on a dedicated page with a link in the header.
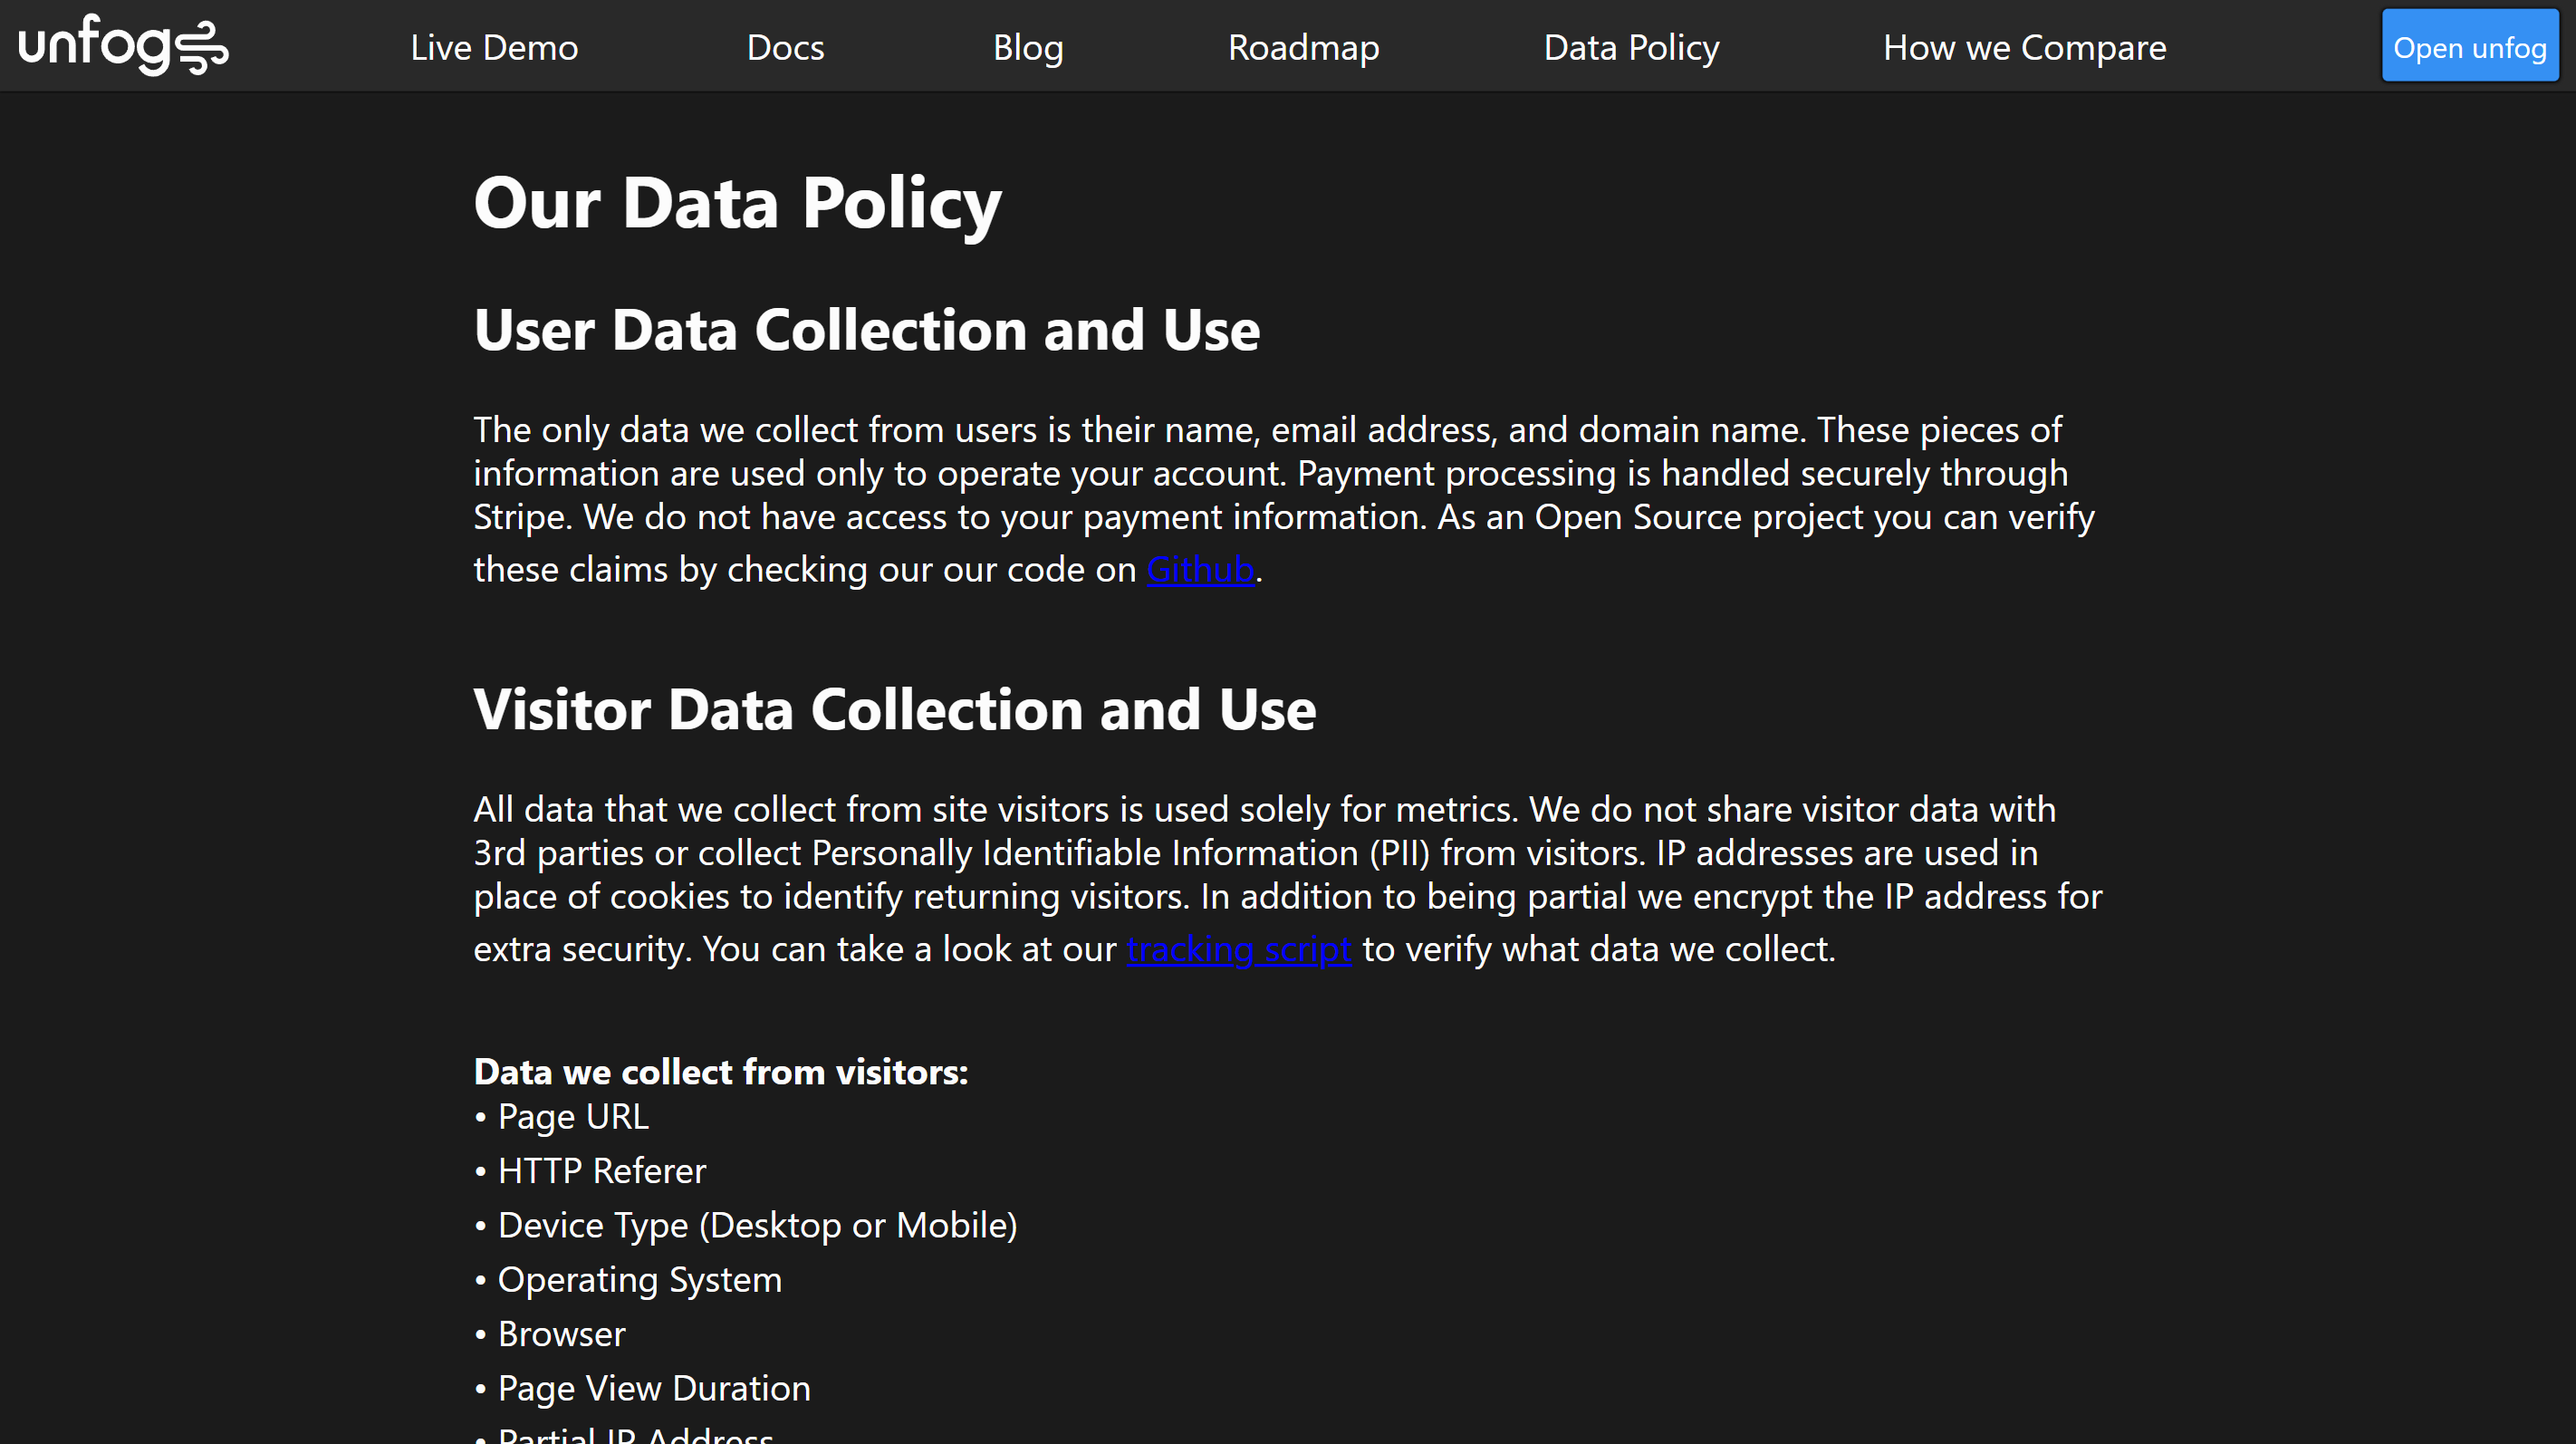
A dedicated page covering how we collect data and what it is used for was added with a link in the header.
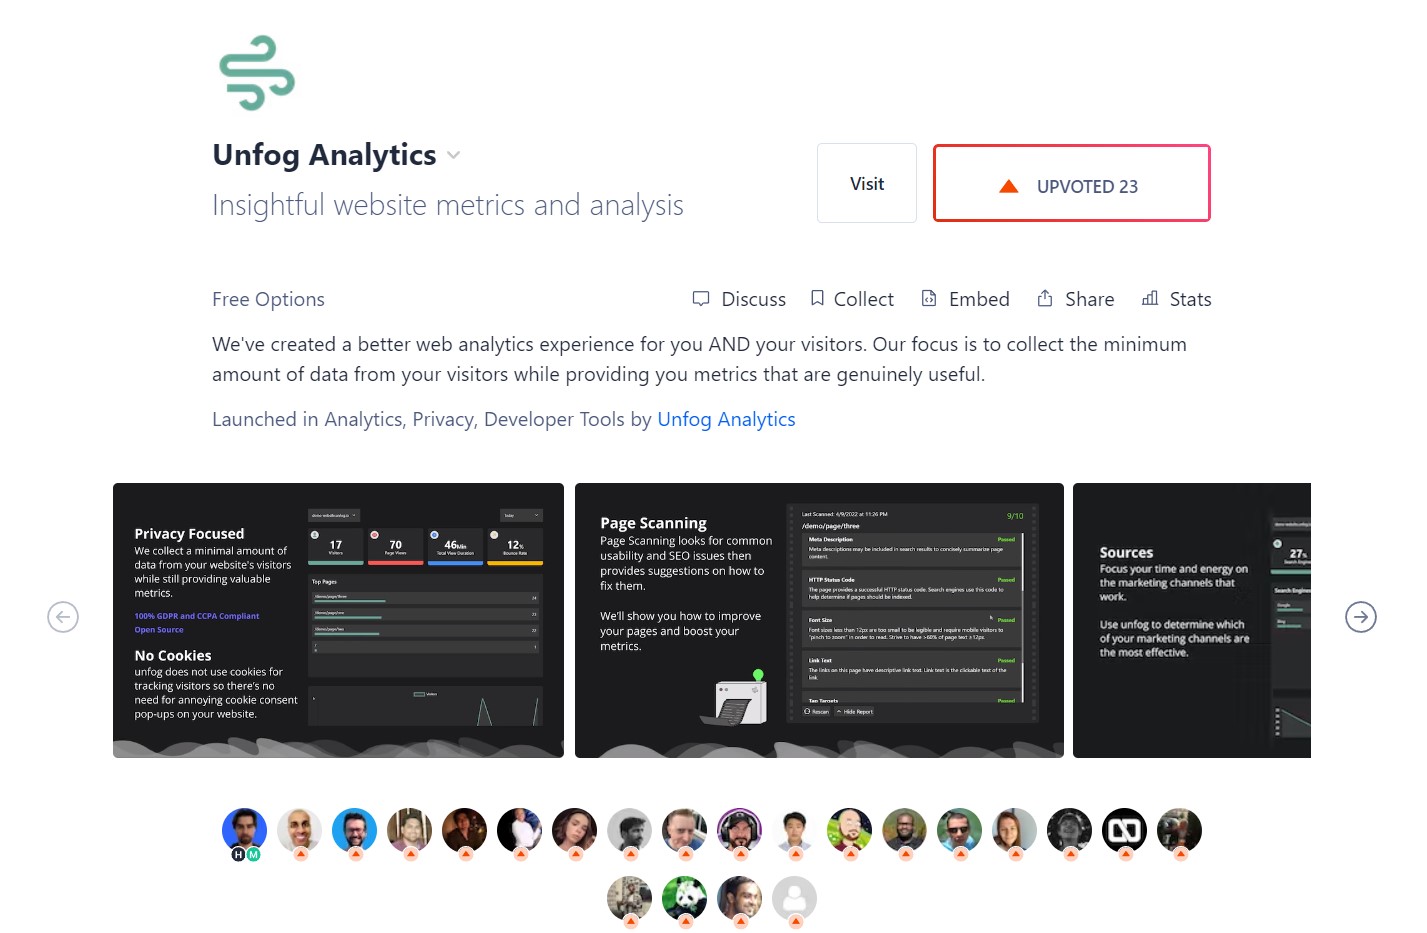
Launching unfog
I launched the product on ProductHunt and it got some attention. You can view it here